Index Diagnostic
Index Diagnostic — is a modal window for diagnosing the system's indexing. It shows how completely and correctly the project's data is indexed in search engines and helps quickly identify the cause if the search returns incomplete records or operates with delays.
The window opens by clicking on the index icon in the top panel of the program (header). More about the icons in the top panel can be found in the section on basic interface elements.
The discrepancy between "Expected" and "In search" is normal during reindexing or immediately after editing attribute sets: the scheduled task (cron) will pull the data during the next indexing. However, if the gap persists even after the next indexing, it is a signal of a problem.
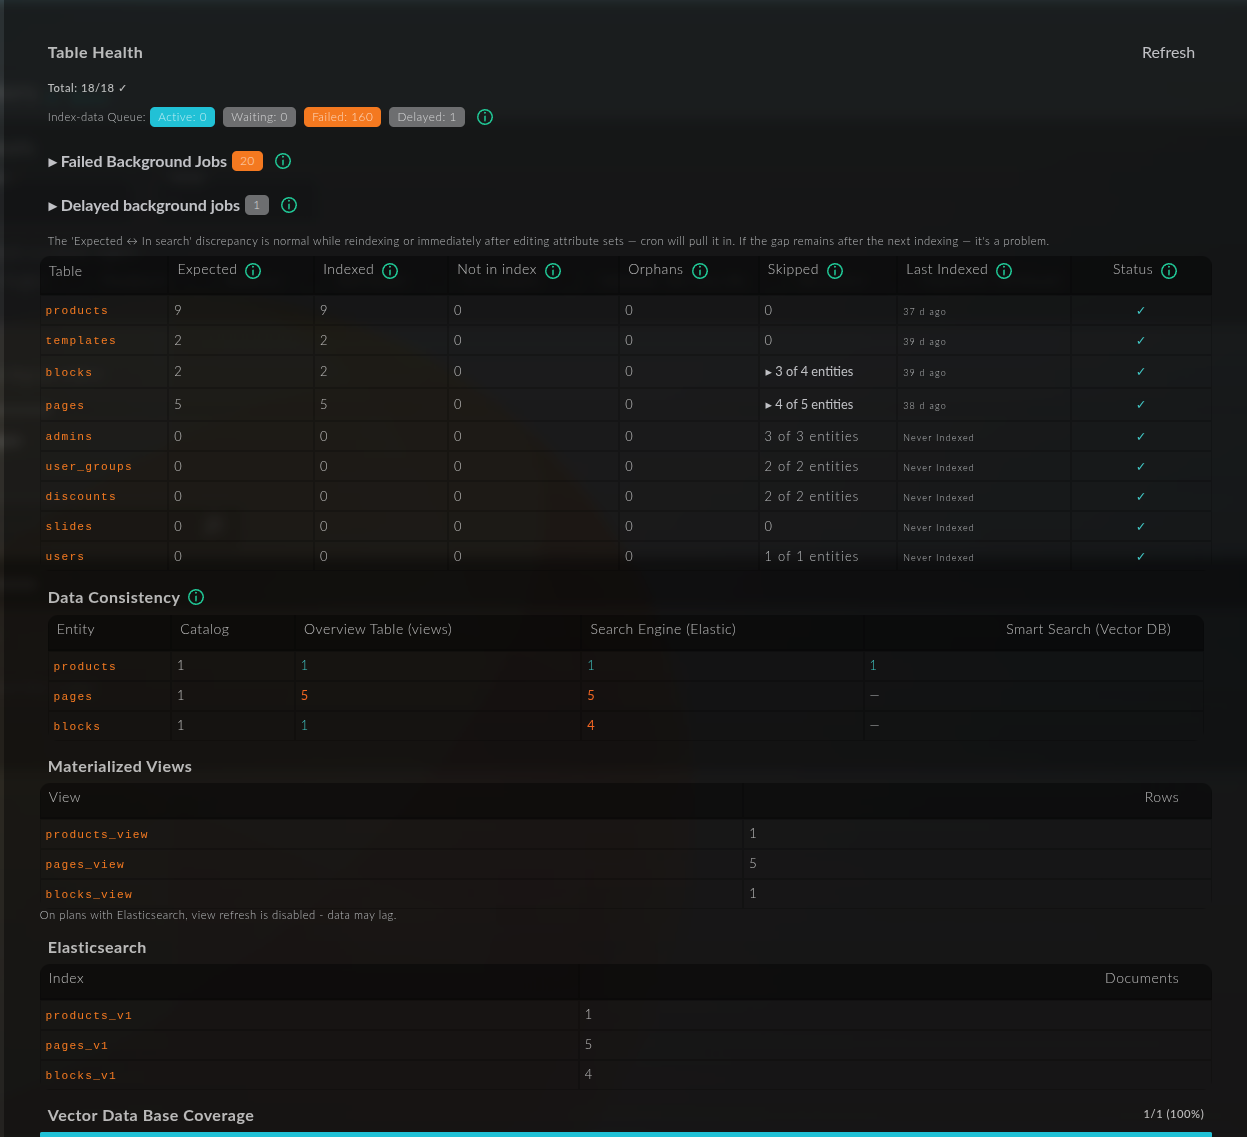
Table Health
The top block reflects the overall state of indexing across all tables in the system.
- Total: N/N ✓ — how many tables out of the total number are in a correct state.
- Index-data Queue — the state of the data indexing task queue:
- Active — tasks currently being executed.
- Waiting — tasks waiting to be executed.
- Failed — tasks that have completed with an error.
- Delayed — postponed tasks.
- Failed Background Jobs — a counter of background tasks that have completed with an error. The block can be expanded to see details.
- Delayed background jobs — a counter of postponed background tasks, which can also be expanded to view details.
Below is a status table for each entity with the following columns:
- Table — the name of the table (products, pages, blocks, admins, discounts, etc.).
- Expected — how many records should be in the index.
- Indexed — how many records have actually been indexed.
- Not in index — how many records are missing from the index.
- Orphans — "orphaned" records: present in the index but no longer in the source data.
- Skipped — records that were skipped during indexing (for example,
3 of 4 entities— skipped for part of the entities; the row can be expanded). - Last Indexed — when the table was last indexed (or
Never Indexedif it has not been indexed). - Status — the final status of the row: ✓ means that everything is fine with the table.
Data Consistency
The Data Consistency block shows the consistency of the number of records between different storage for each entity. This helps to see where the data diverges.
Columns:
- Entity — entity (products, pages, blocks).
- Catalog — the number of records in the main catalog (data source).
- Overview Table (views) — the number in the overview table (materialized views).
- Search Engine (Elastic) — the number of records in Elasticsearch.
- Smart Search (Vector DB) — the number of records in the smart search vector database (a dash
—indicates that the entity is not involved in smart search).
If the values in a row do not match, discrepancies are highlighted in color — this indicates where the data is incomplete.
Materialized Views
The Materialized Views block shows the materialized views (overview tables) and the number of rows in each of them: products_view, pages_view, blocks_view, etc.
In plans with Elasticsearch, view refresh is disabled — the data in this block may lag behind the actual state.
Elasticsearch
The Elasticsearch block lists the search indexes and the number of documents in each of them (products_v1, pages_v1, blocks_v1, etc.). This allows you to verify how many documents the search engine actually holds for each entity.
Vector Data Base Coverage
The Vector Data Base Coverage block reflects the coverage of data in the smart search vector database — for example, 1/1 (100%) means that all suitable records are indexed in the vector DB. A low coverage percentage indicates that some data has not yet been included in the smart search.
Refresh
The Refresh button in the upper right corner of the window updates all diagnostic metrics to obtain the current state of indexing without reloading the page.