Node debug
The debug node is used to output messages and data to the debug log. This node helps track the flow of messages through the stream, check the contents of messages, and troubleshoot issues.
Settings for the debug node
The following parameters are available when configuring the node:
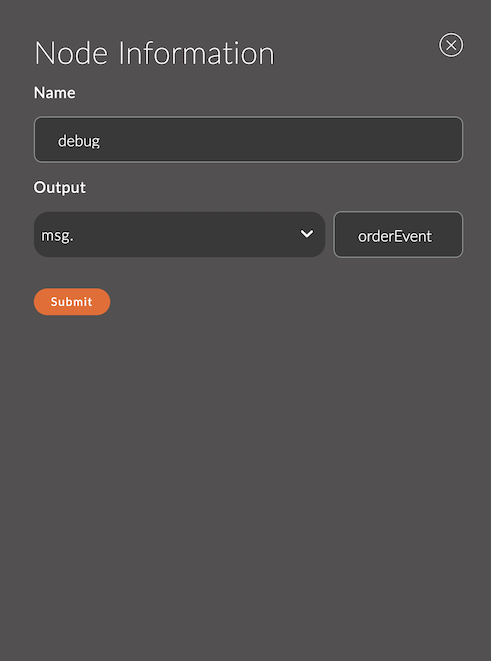
1. Name
A field for specifying the name of the node.
The name is displayed in the workspace and helps easily identify the node.
If left empty, the node will be called debug.
Example:
- Node name:
debug order
2. Output
Specifies which field and what data will be output.
Example:
msg.orderEvent— outputs only the contents of theorderEventproperty.
Usage Example
Example 1: Outputting the contents of msg.payload
The function node passes the string "Hello, World!" to msg.payload, and the debug node outputs this message to the debug panel.
Settings for the debug node:
- Output:
msg.payload
Result in the debug panel:
Hello, World!
Example 2: Outputting custom properties
The function node adds the properties msg.temperature and msg.humidity. The debug node outputs only the temperature value.
Function:
msg.temperature = 25;
msg.humidity = 60;
return msg;
Settings for the debug node:
- Output:
msg.temperature
Result in the debug panel:
25